
Ontario Construction Pipeline & Mechanical Budget Forecast (2025–2030)
Scenario-based forecast for Residential + Commercial building activity in Ontario with an estimated
mechanical budget (HVAC, plumbing, fire protection, pumps and hydronic valves) through 2030. The model is anchored to
recent CMHC/StatCan housing and investment data, Ontario’s 1.5 million homes by 2031 target,
and typical Canadian construction cost benchmarks. Values are indicative, not tender prices.
- ≈ 495,000 new residential units started (single + multi-unit combined)
- ≈ 162 million ft² of new commercial / institutional GFA
- Total mechanical budget (all new-builds): ≈ 32 billion CAD over 6 years
- Annual mechanical market grows from ≈ 4.6 B CAD (2025) to ≈ 6.1 B CAD (2030)
- Within this, valves & hydronic controls rise from ≈ 0.25 B to ≈ 0.30 B CAD per year
1. Residential Pipeline – Housing Starts & Mechanical Budget
The table below assumes Ontario averages around 80–95k housing starts per year in the second half of the
2020s, below the theoretical 150k/year needed for the 1.5 million homes target but above the lows seen in early 2025.
A blended average of 900 ft² per unit and ≈ 55 CAD/ft² for mechanical systems
(HVAC, plumbing, fire, pumps & valves) is used for the estimate.
| Year | Residential Starts (units, median) | Indicative Range (–15% / +15%) | New Res. GFA (million ft²) | Mech. Budget (B CAD) |
|---|---|---|---|---|
| 2025 | 70,000 | 60k – 81k | 63.0 | ≈ 3.5 |
| 2026 | 75,000 | 64k – 86k | 67.5 | ≈ 3.7 |
| 2027 | 80,000 | 68k – 92k | 72.0 | ≈ 4.0 |
| 2028 | 85,000 | 72k – 98k | 76.5 | ≈ 4.2 |
| 2029 | 90,000 | 77k – 104k | 81.0 | ≈ 4.5 |
| 2030 | 95,000 | 81k – 109k | 85.5 | ≈ 4.7 |
2. Commercial & Institutional Pipeline – GFA & Mechanical Budget
For non-residential projects, the model uses a blended new-build rate of 25–30 million ft²/year of
commercial + institutional floor area in Ontario, with an indicative mechanical cost of ≈ 45 CAD/ft².
For context, typical Canadian commercial construction hard costs are often in the 200–300 CAD/ft² range, with major
systems (MEP + fire) representing a significant share of that.
| Year | New Comm/Inst. GFA (million ft²) | Mech. Budget (B CAD) | Approx. # of 150k ft²-equivalent Projects |
|---|---|---|---|
| 2025 | 25.0 | ≈ 1.1 | ≈ 165 |
| 2026 | 26.0 | ≈ 1.2 | ≈ 175 |
| 2027 | 27.0 | ≈ 1.2 | ≈ 180 |
| 2028 | 28.0 | ≈ 1.3 | ≈ 185 |
| 2029 | 29.0 | ≈ 1.3 | ≈ 195 |
| 2030 | 30.0 | ≈ 1.4 | ≈ 200 |
3. Total Mechanical Market & Subsystem Split (Ontario)
Combining residential and non-residential new-builds, Ontario’s annual mechanical market for 2025–2030 is in the
≈ 4.6–6.1 billion CAD range in this scenario. The breakdown below uses indicative subsystem shares:
HVAC 55%, Plumbing 23%, Fire 10%, Pumps 7%,
Valves & Hydronic Controls 5%.
| Year | Total Mech. Market (B CAD) | HVAC (B CAD) | Plumbing (B CAD) | Fire (B CAD) | Pumps (B CAD) | Valves & Hydronic Controls (B CAD) |
|---|---|---|---|---|---|---|
| 2025 | ≈ 4.6 | ≈ 2.5 | ≈ 1.1 | ≈ 0.5 | ≈ 0.3 | ≈ 0.25 |
| 2030 | ≈ 6.1 | ≈ 3.3 | ≈ 1.4 | ≈ 0.6 | ≈ 0.4 | ≈ 0.30 |
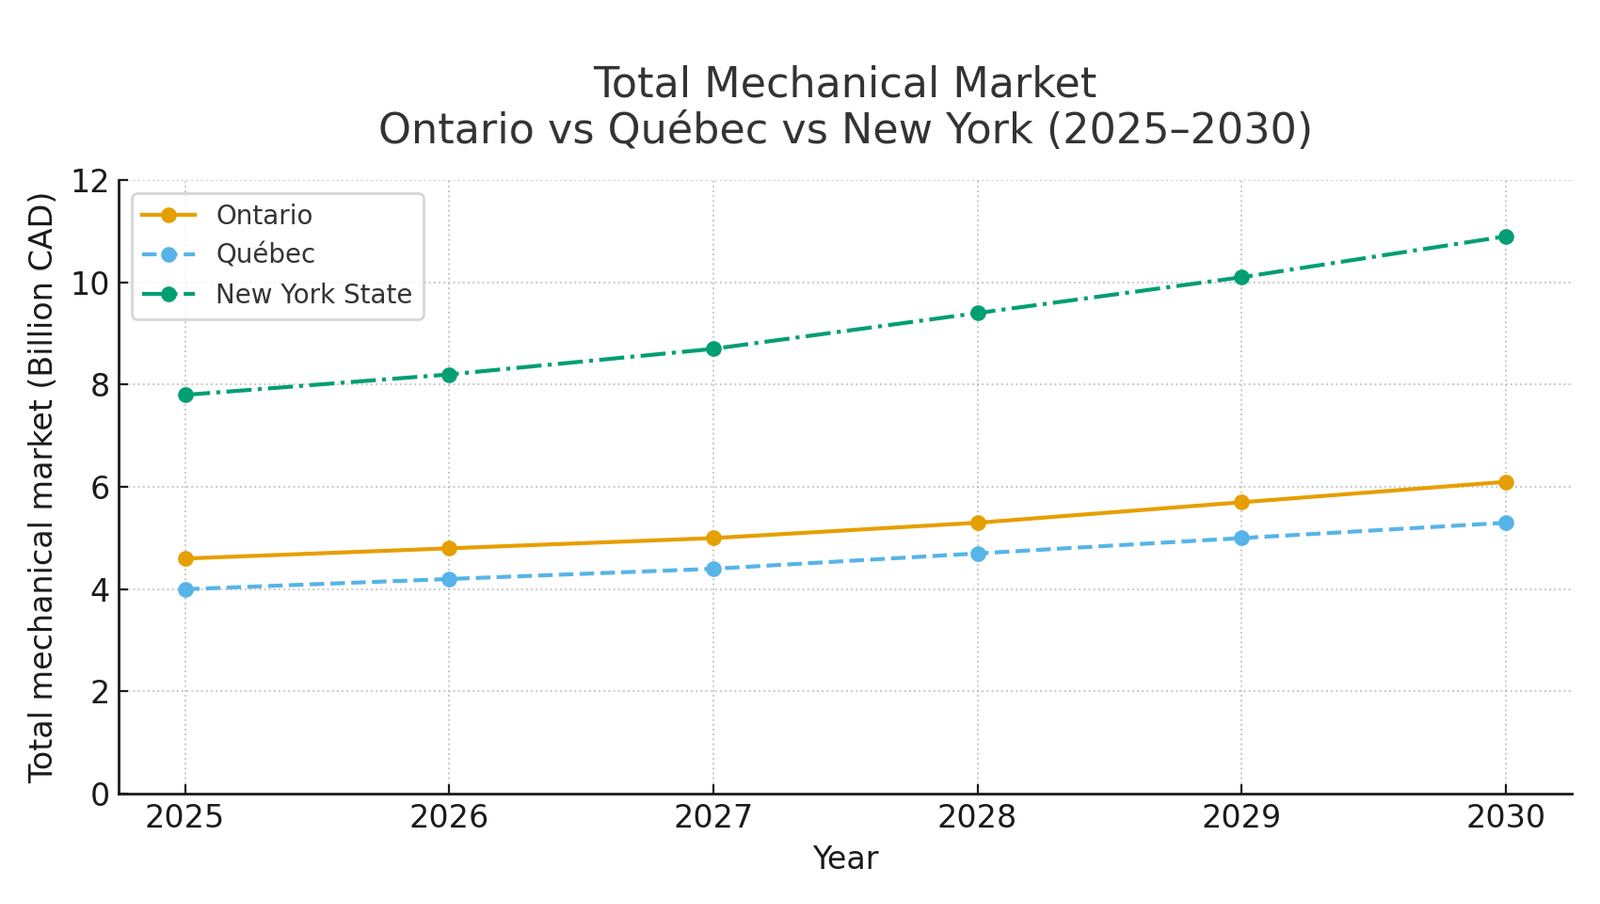
3.1 Regional Mechanical Market Comparison – Ontario vs Québec vs New York
Indicative total mechanical market size (new-build) for Ontario, Québec and New York State.
Lines show median trajectories between 2025 and 2030; values are rounded.
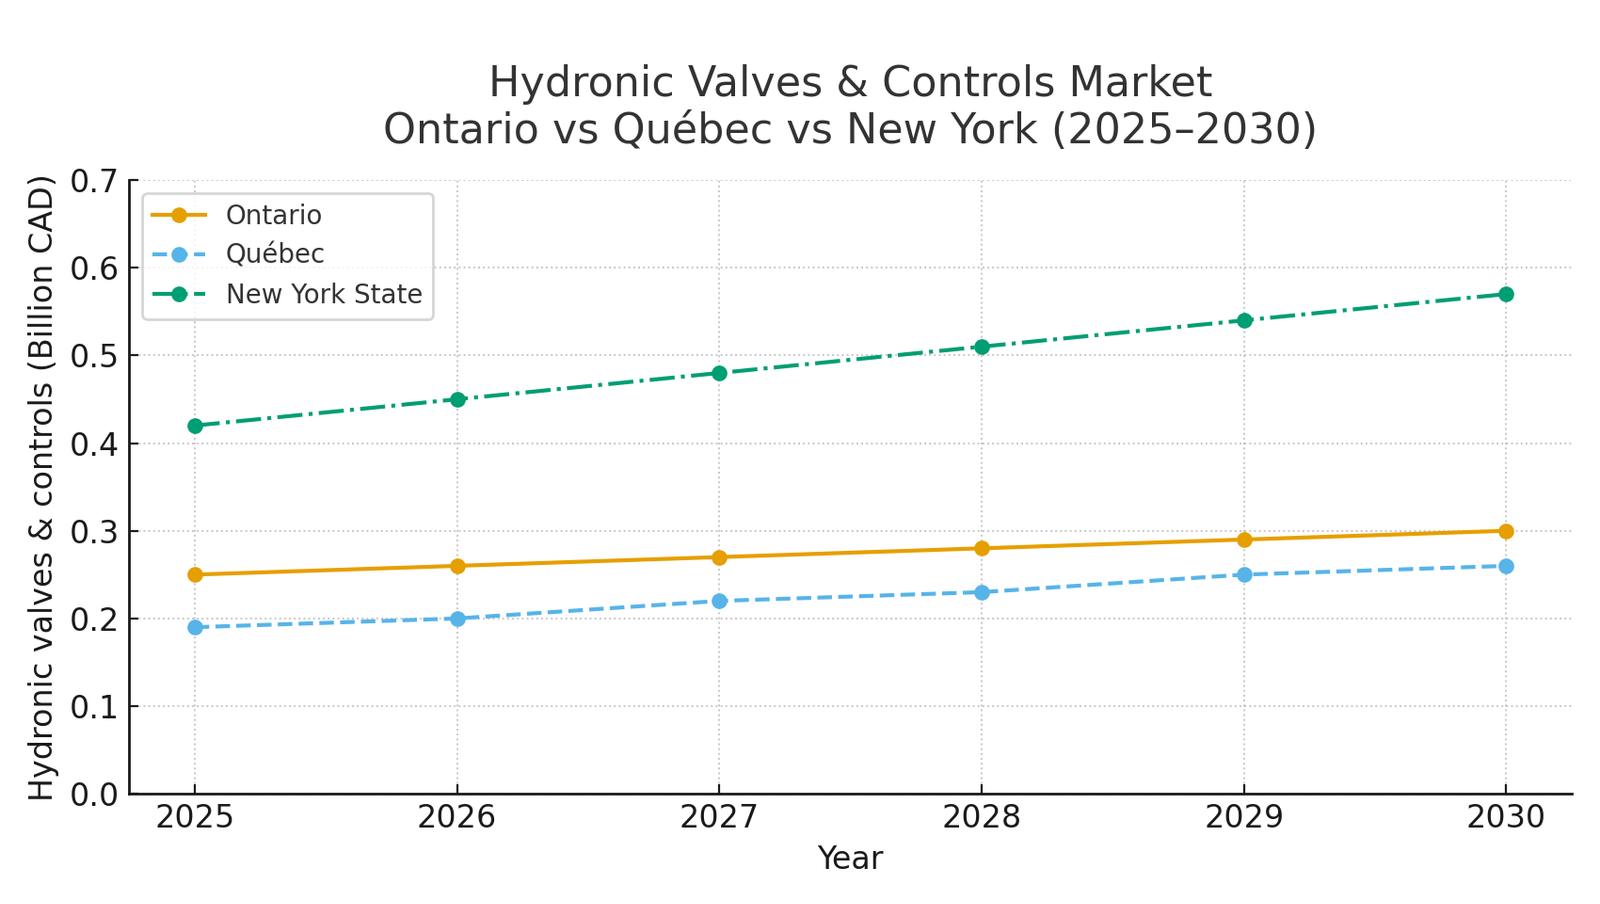
3.2 Hydronic Valves & Controls Market – Ontario vs Québec vs New York
Indicative annual market volume for hydronic valves and balancing/controls in new-build projects.
Values are a subset of the total mechanical market and highlight the growing relevance of hydronic optimization.
- Central heating & cooling plant (boilers, chillers, heat pumps)
- Air distribution (AHUs, RTUs, FCUs, duct systems, diffusers & grilles)
- DDC/BAS controls related to airside and plant operation
- Make-up air units & outdoor air ventilation systems
- Exhaust systems (washrooms, parkings, commercial kitchens where applicable)
- Refrigerant piping & safety systems (VRF / heat pump applications)
Not included in HVAC scope:
- Domestic plumbing fixtures & drainage
- Fire protection (sprinklers, standpipes, fire pumps)
- Pumping groups serving hydronic circuits & water systems
- Valves & hydronic balancing devices (tracked separately in this report)
energy-efficiency frameworks commonly referenced in ASHRAE 90.1 / 189.1. For project-specific
interpretation, always consult the design team and local code authority.*
- Québec: Higher heat pump penetration, slightly lower HVAC capex/ft², but higher electric service costs.
- New York State: Stronger gas bans & electrification bylaws → higher HVAC + controls capex; tighter fire & life-safety standards.
- Ontario: Mid-range regulatory pressure, more flexible adoption path, significant upside for hydronic optimization and quality valves.
preliminary budgeting, supply planning, and strategic decisions around HVAC, hydronic systems, and
balancing valves in Ontario’s 2025–2030 construction pipeline.*